Source Level Debugging with Intel(R) UDK Debugger
This explains how to perform basic debugging operation with Intel UDK Debugger on SBL over serial port.
Prerequisite
Install Intel UDK Debugger, using the Intel© UDK Debugger Tool on a Windows platform requires a host machine configured with:
Microsoft Win7 x64 or Win8 x64 or Win10 x64
Microsoft Windows Debug Tool(WinDbg) 6.11.0001.404 X86.
The Intel© UDK Debugger can be downloaded here for Windows and this for Linux, install Intel UDK Debugger with default configuration values.
Install Windows Debug Tool(WinDbg) with default configuration values.
General Steps
Step 1 - Enable Debug Agent
Enable DebugAgent on SBL and flash the SBL image(or IFWI) on TARGET. By default, DebugAgent is not enabled. It can be simply enabled with a single line change.
Open
BoardConfig.pyof specific platform, set ENABLE_SOURCE_DEBUG to 1:self.ENABLE_SOURCE_DEBUG = 1
Apollo Lake platform requires to set SKIP_STAGE1A_SOURCE_DEBUG to 1:
self.SKIP_STAGE1A_SOURCE_DEBUG = 1
Note
On Apollo Lake platform , the Stage1A has size limitation for debugging which require set SKIP_STAGE1A_SOURCE_DEBUG to 1
Build SBL source code
Stitch IFWI and flash SBL Image on system board
Step 2 - Configure Intel UDK Debugger Environment on Host
Configuration file default location
Windows:
C:\Program Files (x86)\Intel\Intel(R) UEFI Development Kit Debugger Tool\SoftDebugger.iniLinux:
/etc/udkdebugger.conf
[Debug Port] option:
[Debug Port]
Channel = Serial    <== Must be Serial
Port = COM5         <== Change properly
FlowControl = 0     <== 0 for now**
BaudRate = 115200   <== Change properly
Server =            <== Can be empty
For TCP port configuration:
[Debug Port]
Channel = TCP
Server = 127.0.0.1
Port = 1234
For PIPE port configuration:
[Debug Port]
Channel = Pipe
Port = /tmp/serial
Tip
How to create a pipe in Linux:
mkfifo /tmp/serial.in

mkfifo /tmp/serial.out
[Target System] option:
[Target System]
FlashRange        = 0xFEF00000:0x1100000     <== This must be added for Apollo Lake platform for code execution debugging in CAR
For QEMU target specific, set NoAccessLimit option is required:
[Target System]
FlashRange = 0xFFE00000:0x200000
NoAccessLimit = 0
[Maintenance] option:
[Maintenance]
Trace=0x10          <== This is optional. 0x0: Disable trace output, 0x3f: Enable full trace output
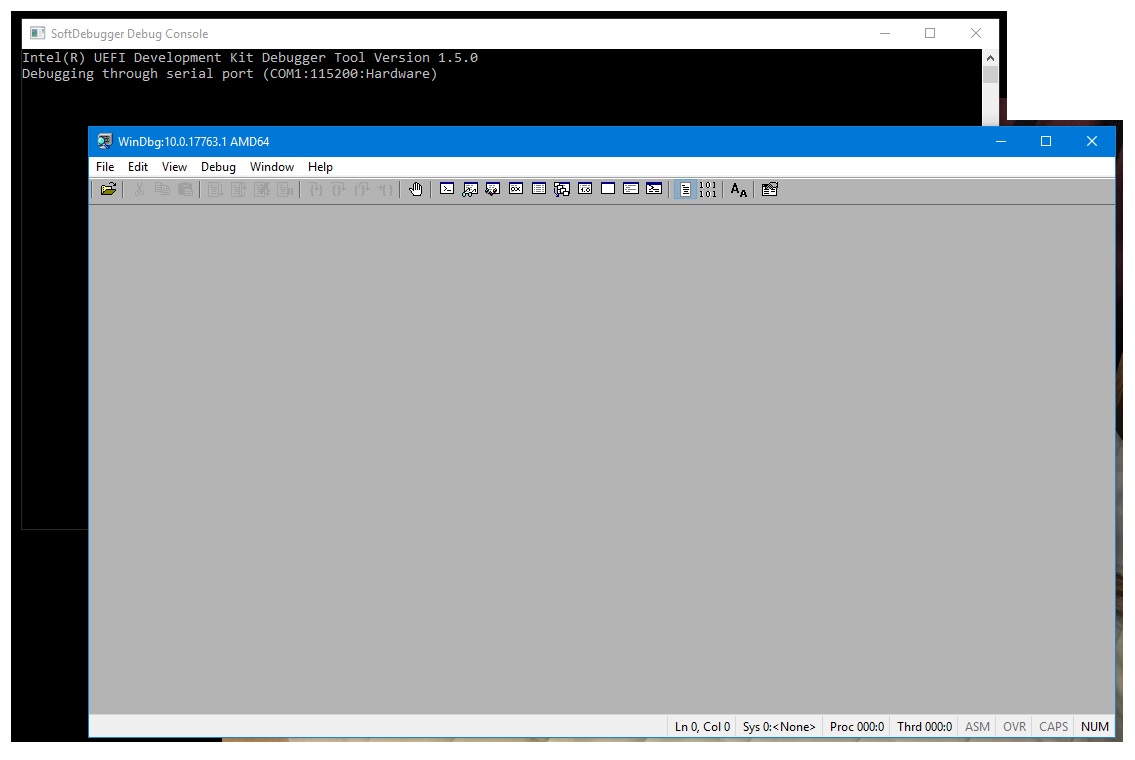
Step 3 - Launch Intel UDK Debugger on Host
Windows - Launch “Start WinDbg with Intel UDK Debugger Tool” from Windows Start Menu
Linux - Launch:
/opt/intel/udkdebugger/bin/udk-gdb-server
Note
To debug QEMU with TCP port configuration, execute Step 4 before Step 3.
Step 4 - Power on TARGET platform
Windows - Power on TARGET platform, the connection of HOST and TARGET will be established immediately.
Linux
Power on TARGET platform
Launch GDB in a separate terminal
Make a connection with GDB target command
Run:
target remote :1234
or from Intel UDK Debugger console:
target remote FULL_SERVER_URL:1234
Start Intel UDK Debugger scripts for GDB
Run:
source /opt/intel/udkdebugger/script/udk_gdb_script
To turn on QEMU target with TCP port configuration, follow run qemu-system first then launch Intel UDK Debugger as Step 3
Windows:
qemu-system-x86_64.exe -m 256M -machine q35 -nographic -pflash Outputs/qemu/SlimBootloader.bin -serial tcp:127.0.0.1:1234,server
Linux:
qemu-system-x86_64 -m 256M -machine q35 -nographic -pflash Outputs/qemu/SlimBootloader.bin -serial tcp:127.0.0.1:1234,server
Step 5 - Start debugging
Start debugging with WinDbg or GDB